
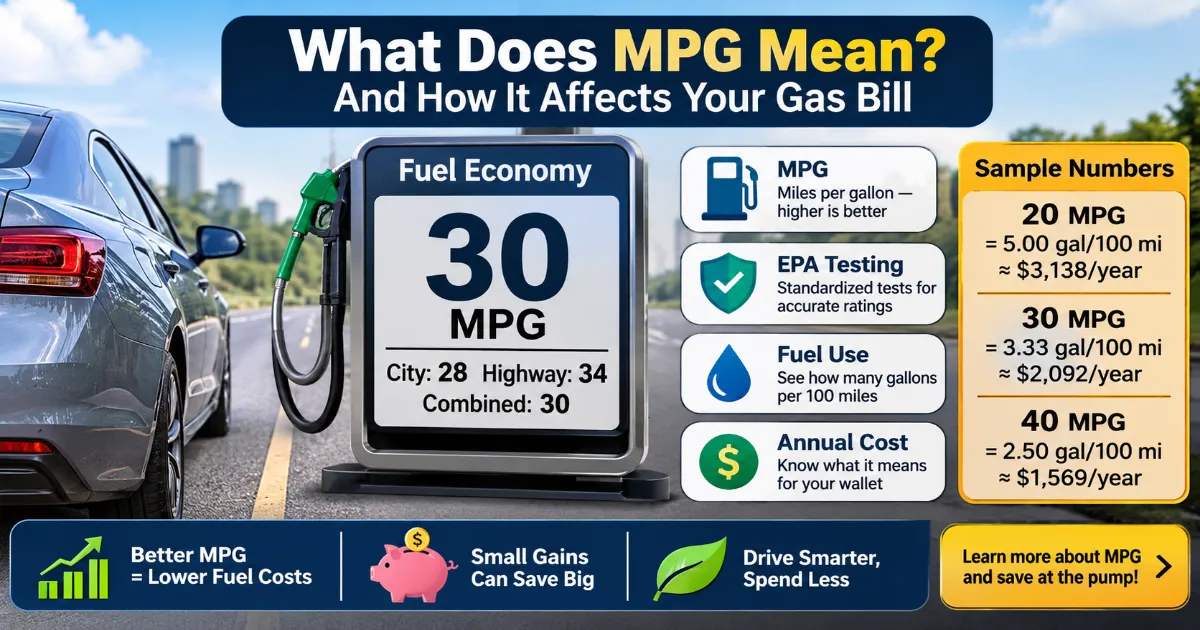
 MPG, gallons per 100 miles and gas bills explained: what does MPG mean for your wallet
MPG shows up on every new-car window sticker, in every car ad and in most arguments about which vehicle to buy. Yet many drivers use the number without knowing exactly what it measures, how it is tested, or why going from 10 to 15 MPG saves far more fuel than going from 30 to 35. This guide explains what MPG means, how the EPA arrives at the numbers on the label, how MPG turns into dollars at the pump, and why your own mileage may differ from the sticker.
It uses US sources: the EPA and fueleconomy.gov (the government’s fuel economy site), AAA and EPA’s Automotive Trends Report. Gas-price math uses the AAA national average from October 31, 2026, and the same 15,000-mile year the EPA label uses. Where a figure is my own arithmetic, the article says so.Federal Tax Credit for Electric Vehicles: What Changed in 2026?
What Does a Car Warranty Cover, and What Does It Exclude?
What Does MPG Mean? The Simple Definition
MPG stands for miles per gallon: the number of miles a vehicle can travel on one gallon of fuel. A car rated at 30 MPG can, under the conditions of the test, go about 30 miles on a gallon of gasoline. Higher is better, because you buy less fuel for the same trip.
On a US window sticker, gasoline vehicles list three MPG numbers:
- City MPG. Based on stop-and-go driving.
- Highway MPG. Based on steadier, faster driving.
- Combined MPG. The headline number. The EPA’s fueleconomy.gov explains that combined MPG is a weighted average of 55% city and 45% highway, and that it is the most prominent figure on the label “for the purpose of quick and easy comparison across vehicles.”
Plug-in vehicles add a figure called MPGe, explained below.
How the EPA Tests Fuel Economy
The numbers on the sticker are not made up by the dealer or guessed from road tests. According to EPA’s description of its testing program, manufacturers run the tests and submit data for each model each year, and EPA confirms about 15% of the results. Vehicles are tested over five driving cycles: city, highway and a more aggressive high-speed cycle, all without air conditioning or heat, plus a hot test at 95°F with the cooling on and a cold test at 20°F with heat and defrost on. The results are combined and weighted to estimate average use.
EPA describes the official MPG value as a weighted estimate of average real-world use, built from those five cycles. It is a standardized estimate, not a promise, and the next sections explain why individual results vary.
The MPG Illusion: Why Gallons per 100 Miles Can Be More Useful
MPG has a quirk. Because it measures distance per unit of fuel, equal MPG improvements do not save equal amounts of fuel. Fueleconomy.gov makes this point directly: it argues that consumption measures, such as gallons per mile or per 100 miles, can give more accurate energy-use comparisons than MPG, and the label now shows both economy and consumption information. It illustrates the effect with fuel saved over 1,000 miles: about 33 gallons going from 10 to 15 MPG, but only about 5 gallons going from 30 to 35 MPG.
I checked the arithmetic: 1,000 miles at 10 MPG uses 100 gallons and at 15 MPG uses about 66.7, a saving of 33.3. At 30 MPG it uses 33.3 gallons and at 35 MPG about 28.6, a saving of 4.8.
The table below converts several MPG ratings to gallons per 100 miles. All gallon and dollar figures in this article are my calculations.
| MPG | Gallons per 100 miles |
|---|---|
| 15 | 6.67 |
| 20 | 5.00 |
| 25 | 4.00 |
| 30 | 3.33 |
| 35 | 2.86 |
| 40 | 2.50 |
| 50 | 2.00 |
The lesson: upgrading from a very thirsty vehicle matters more than the same MPG gain on an already efficient one. A move from 20 to 25 MPG cuts consumption by a full gallon per 100 miles, while a move from 40 to 45 cuts it by only about 0.28 gallons.
How MPG Turns Into Fuel Costs
To convert MPG into dollars you need three numbers: miles driven, MPG and the price of gas. The EPA label’s annual fuel cost uses 15,000 miles a year and a projected fuel price (the sample label’s $3.70 per gallon is for illustration only). I use the same 15,000 miles and the AAA national average for regular gasoline of $4.1837 per gallon on October 31, 2026. Gas prices change weekly and vary a lot by state, so your numbers will differ.
The formula is: (miles per year ÷ MPG) × price per gallon.
| MPG | Gallons per year (15,000 mi) | Annual fuel cost at $4.18/gal | Cost per mile |
|---|---|---|---|
| 15 | 1,000 | $4,184 | 27.9¢ |
| 20 | 750 | $3,138 | 20.9¢ |
| 25 | 600 | $2,510 | 16.7¢ |
| 30 | 500 | $2,092 | 13.9¢ |
| 35 | 429 | $1,793 | 12.0¢ |
| 40 | 375 | $1,569 | 10.5¢ |
| 50 | 300 | $1,255 | 8.4¢ |
What the table shows, by my arithmetic:
- Going from 20 to 30 MPG saves about $1,046 a year at these assumptions.
- Going from 25 to 30 MPG saves about $418 a year.
- Going from 30 to 35 MPG saves about $299 a year.
- A 50-MPG vehicle costs about $1,255 less a year to fuel than a 25-MPG vehicle.
Over a five-year loan, these differences compound, which is why the EPA label also includes a five-year fuel cost comparison against the average new vehicle, shown as an amount saved or spent extra. Multiply any annual saving by the years you will own the car, then compare it with the price difference between models. A fuel-efficient version that costs thousands more may or may not pay for itself in your situation.
Current Gas Prices: Why the Math Moves
AAA reported a national average for regular of $4.1837 on October 31, 2026. Its weekly figures that month fell from $4.41 on October 1 to $4.22 on October 29, a drop of about 19 cents. AAA’s commentary attributed part of the drop to the switch to cheaper-to-make winter-blend gasoline, and noted crude oil near or above $100 a barrel was limiting further declines.
Because prices swing, a quick way to update the table is to scale it: every 10-cent move in the gas price changes the annual cost of a 25-MPG car driven 15,000 miles by $60 (600 gallons × $0.10), and of a 30-MPG car by $50.
Why Your Real MPG Differs From the Sticker
EPA says its estimates reflect average conditions, and fueleconomy.gov lists the main reasons yours may differ:
- Aggressive driving. Speeding, rapid acceleration and hard braking lower gas mileage by about 15% to 30% at highway speeds and 10% to 40% in stop-and-go traffic.
- Air conditioning. With the air conditioner on “Max,” fuel economy drops roughly 5% to 25% compared with not using it.
- Speed. Higher speeds increase aerodynamic drag and reduce fuel economy. The fueleconomy.gov page I reviewed gives no percentage.
- Idling. Excessive idling lowers MPG, and idling to warm up the car does not help.
- Weight and towing. Extra cargo weight and towing decrease fuel economy. Fueleconomy.gov notes EPA testing assumes only 300 pounds of passengers and cargo.
- Roof racks and cargo on top. They add drag and lower fuel economy.
- Tire pressure and alignment. Improper inflation or alignment increases rolling resistance and lowers fuel economy.
Cold weather
Fueleconomy.gov’s cold-weather page gives two sets of numbers for gasoline cars, and I am citing the updated estimates: a 10% to 20% loss in city driving and a 15% to 33% loss on short trips, with an earlier figure of about 15% at 20°F compared with 77°F, rising to as much as 24% on 3-to-4-mile trips. The page says short trips hurt more because the engine spends more of the trip before reaching its efficient operating temperature. Hybrids are hit harder, with an updated estimate of 20% to 40% in city driving and 25% to 45% on short trips. Idling to warm up does not help.
If you drive in cold climates, the winter MPG you see may be well below the sticker, so budget for it.
What About Hybrids and Electric Cars? Understanding MPGe
Electric and plug-in vehicles use a different unit. MPGe, or miles per gallon of gasoline equivalent, lets you compare an electric vehicle with a gas car. EPA treats the energy in one gallon of gasoline as equal to 33.7 kilowatt-hours of electricity, and AAA’s explanation gives the formula for an EV: miles driven divided by kWh used, multiplied by 33.7. EPA says MPGe includes charging losses, measured at the wall outlet and assuming Level 2 AC charging.
Two cautions from the sources:
- MPG and MPGe are not directly equivalent. AAA notes that gasoline engines are roughly 17% to 30% efficient at moving a car, while EVs are about 80% efficient, which explains large differences between similar-looking ratings.
- MPGe does not tell you the cost. AAA’s explanation does not discuss fuel or electricity prices. A higher MPGe does not automatically mean lower running costs, because electricity and gasoline are priced differently and electricity rates vary widely.
An illustrative cost comparison
To turn MPGe into a cost, you need the vehicle’s miles per kWh and your electricity price. AAA’s 2026 Your Driving Costs study assumed home electricity for EV charging at 18 cents per kWh, a figure I use here only as an example, not a prediction for your area. An EV that travels 3.5 miles per kWh would be rated about 118 MPGe (3.5 × 33.7, my calculation) and cost about 5.1 cents per mile at 18 cents per kWh, or about $771 for 15,000 miles. Compared with the 30-MPG gasoline car’s $2,092 in the table above, that is a gap of about $1,320 a year at these assumptions. Public fast charging often costs more than home charging, and the sources I reviewed do not give those prices, so a driver who charges mostly in public would see a different result.
For plug-in hybrids and hybrids, read the label’s separate electric and gas figures, and remember the cold-weather loss for hybrids above.
How Efficient Are New Cars Today?
EPA’s Automotive Trends Report (page last updated February 19, 2026) says the average real-world fuel economy of new vehicles for model year 2024 was a record 27.2 MPG, up 0.1 MPG from the prior year and up 41% from model year 2004. Fuel economy has improved in 16 of the last 20 years, and early data suggest model year 2025 will continue to rise. The same page says battery-electric vehicles fell from 10% to 7% of new vehicles in model year 2024.
That 27.2 MPG average is a useful yardstick: a vehicle rated well above it will usually cost less to fuel than a typical new car, and one rated well below it will cost more. At 27.2 MPG and the assumptions above, a driver covering 15,000 miles uses about 551 gallons a year, costing about $2,307 (my calculation).
Practical Ways to Lower Your Fuel Bill
Based on the factors above:
- Compare cars by gallons per 100 miles and annual fuel cost, not just MPG, using the label’s consumption and cost figures.
- Drive smoothly. Avoiding speeding, hard acceleration and hard braking is the largest effect fueleconomy.gov quantifies, up to 30% on the highway.
- Use the air conditioner thoughtfully. The “Max” setting can cost 5% to 25%.
- Keep tires properly inflated and aligned.
- Remove unneeded weight and roof racks.
- Combine short trips, especially in cold weather, when short trips lose the most.
- Do not idle to warm up.
- Track your actual MPG by recording miles and gallons at each fill-up, then use your own number in the cost formula.
How to Calculate Your Own MPG
Fill the tank, reset the trip odometer, drive normally, then fill up again. Divide the miles driven by the gallons you added. For example, 330 miles on 11 gallons is 30 MPG. Average several fill-ups for a reliable figure, since one tank can be skewed by a long highway trip or a cold snap.
Frequently Asked Questions
What does MPG mean?
MPG means miles per gallon: how many miles a vehicle can travel on one gallon of fuel, as measured in a standardized test. Higher numbers mean less fuel used per mile.
What is a good MPG?
It depends on the vehicle type. For context, EPA reports an average of 27.2 MPG for new vehicles in model year 2024. Anything well above that is more efficient than the average new vehicle.
What is combined MPG?
A weighted average of city and highway ratings: 55% city and 45% highway, according to fueleconomy.gov. It is the headline number on the label.
How much does MPG affect fuel costs?
A lot over a year. At 15,000 miles and $4.18 per gallon, a 20-MPG vehicle costs about $3,138 a year to fuel and a 30-MPG vehicle about $2,092, a gap of roughly $1,046 (my calculations).
Why is my real MPG lower than the sticker?
Driving style, air conditioning, speed, cold weather, weight, towing, roof racks and tire pressure all lower it. Fueleconomy.gov says aggressive driving alone can cut mileage 15% to 30% on the highway.
Is MPGe the same as MPG?
No. MPGe compares the energy an electric vehicle uses with the energy in a gallon of gasoline (33.7 kWh). It does not tell you the cost, which depends on your electricity rate.
Does cold weather really hurt gas mileage?
Yes. Fueleconomy.gov’s updated estimates are a 10% to 20% loss in city driving and 15% to 33% on short trips for gasoline cars, and larger losses for hybrids.
Is gallons per 100 miles better than MPG?
For comparing fuel use, often yes. Fueleconomy.gov argues that consumption measures give more accurate comparisons, and the EPA label shows both.
How are MPG ratings tested?
Manufacturers test vehicles over five driving cycles, and EPA confirms about 15% of the results.
The Bottom Line
What does MPG mean for your money? It is the starting point for a calculation: divide your annual miles by the MPG, then multiply by the price of gas. The biggest savings come from replacing a thirsty vehicle, not from tweaking an efficient one, which is why gallons per 100 miles can be a better yardstick. Use the label as a guide, expect your own number to differ with how and where you drive, and track your actual mileage to see what you really spend.
🔹🔹 Follow us on Facebook 🔹🔹